
In the next installment of our series of team profiles, we introduce the newest member: Obi.

Name: Obi Iweka
When did you join Smarter Households?
I joined the Smarter Households project in January 2017
I joined the Smarter Households project in January 2017
Where did you previously study?
I obtained a Bachelor’s degree in Electrical Electronics Engineering and a Master’s degree in Computer Science from Federal University of Technology, Nigeria, and Swansea University, UK respectively. I am presently a doctoral student within the Centre for Low Impact Buildings at Coventry University, Coventry.
I obtained a Bachelor’s degree in Electrical Electronics Engineering and a Master’s degree in Computer Science from Federal University of Technology, Nigeria, and Swansea University, UK respectively. I am presently a doctoral student within the Centre for Low Impact Buildings at Coventry University, Coventry.
What is your specialist area?
Data Analysis and Visualization, and Human Energy Interaction
Data Analysis and Visualization, and Human Energy Interaction
What is your role within the Smarter Households project?
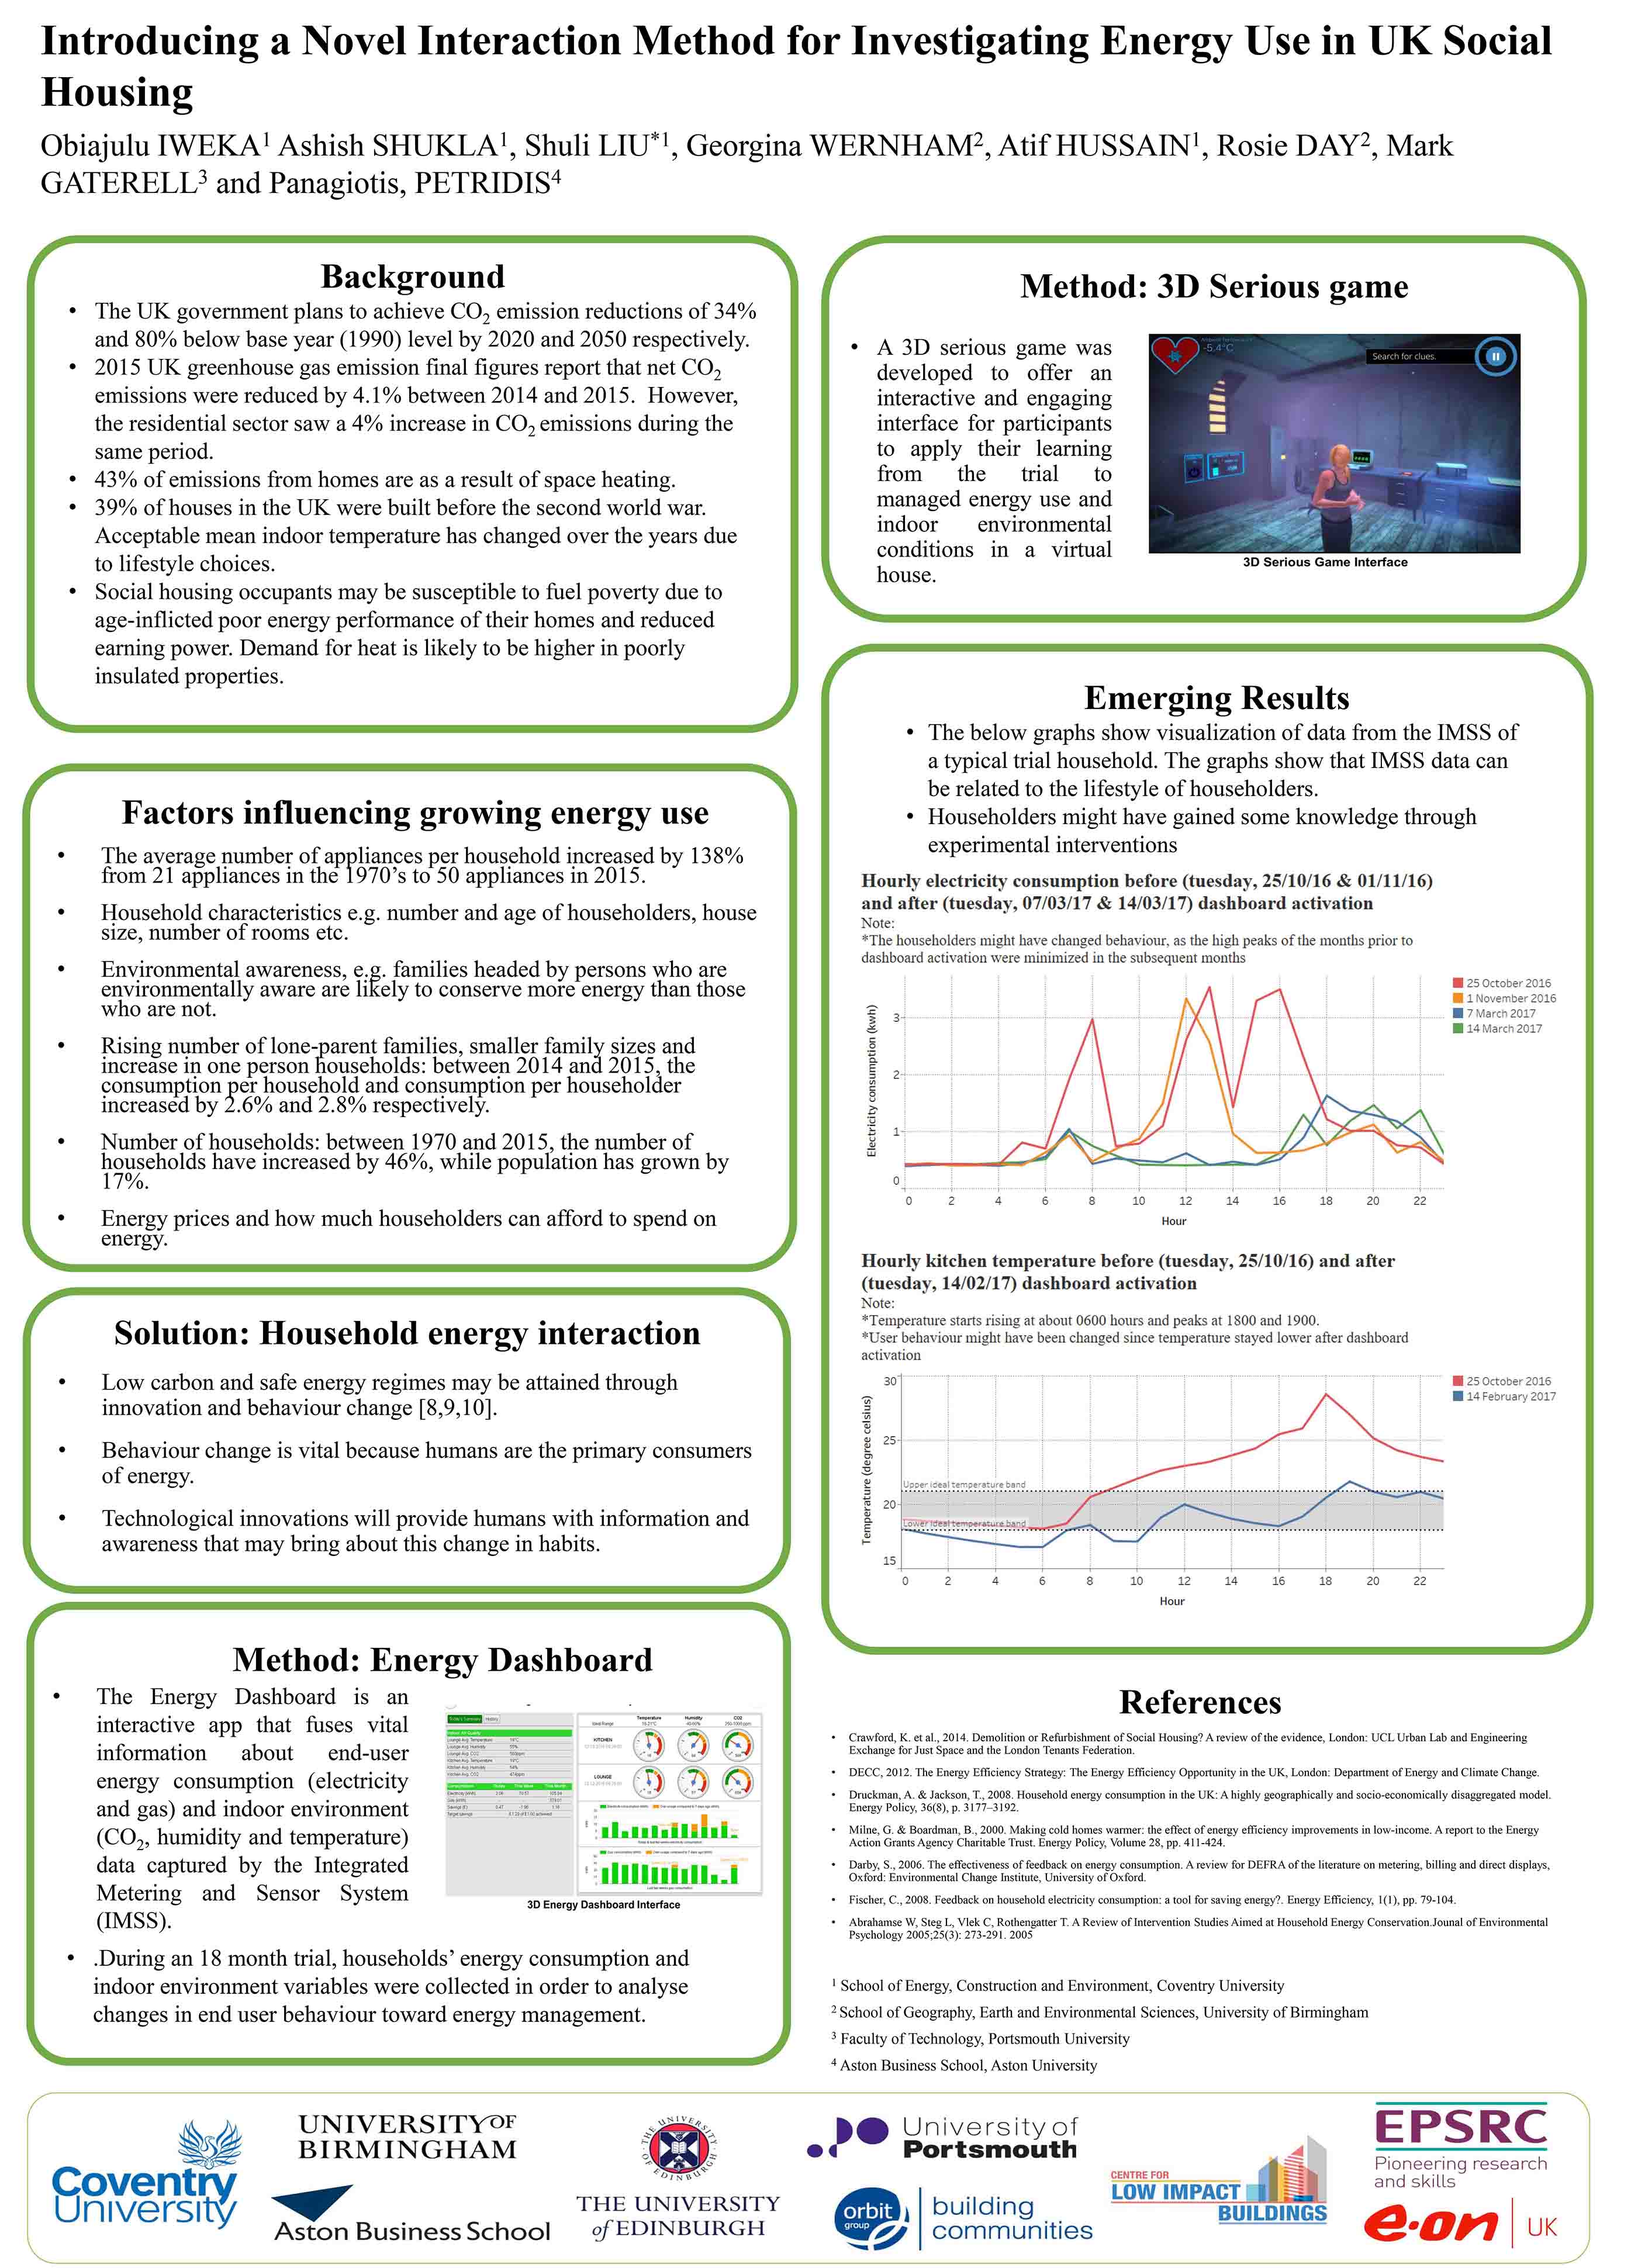
My role within the Smarter Households project is to analyse and visualize the Integrated Meter and Sensor System (IMSS) data. By analysing and visualizing the data, one can observe patterns and trends which can be associated to probable daily activities and lifestyle choices of householders. This analysis will provide insight into the impact of the Energy Dashboard and Energy Game, and any changes that occurred along the way.
My role within the Smarter Households project is to analyse and visualize the Integrated Meter and Sensor System (IMSS) data. By analysing and visualizing the data, one can observe patterns and trends which can be associated to probable daily activities and lifestyle choices of householders. This analysis will provide insight into the impact of the Energy Dashboard and Energy Game, and any changes that occurred along the way.
What excites you about the Smarter Households project?
The Smarter Households project offers a glimpse of what the future holds for the smart ecosystem. It is fascinating to observe how people coexist and respond to sensors, integrated meters and displays in the indoor environment (around them). It will be most exciting to see how numerical data captured by sensors make us more environmentally aware and tell stories about our daily living.
The Smarter Households project offers a glimpse of what the future holds for the smart ecosystem. It is fascinating to observe how people coexist and respond to sensors, integrated meters and displays in the indoor environment (around them). It will be most exciting to see how numerical data captured by sensors make us more environmentally aware and tell stories about our daily living.
It’s been great to read your responses to Challenge 3, where you’ve been using the electricity plug meter to find out how much different appliances in your home cost to use. It was certainly not the most straightforward piece of equipment to use, and some of you have said there are appliances you still want to test, or weren’t able to access.

Therefore we’ve compiled a list of example costs per use, based on an electricity unit price of 15.41p/kWh (UK average as of March 2017).
All costs are in pence and fractions of a penny, unless a pound sign is used.
Dyson DC41 Mk2 Animal Upright Vacuum Cleaner- 700W
0.11p per hour of use
Breville 1650 W4 slice toaster
1.27p for 3 minutes
Samsung ME731K 800W Microwave
~1.44p per 5 minutes
Russell Hobbs Nevis Electric Kettle – 1.7L, 3000 W
2.89p per boil (full kettle)
LG standard size dishwasher (model D1484WF)
12.65p per cycle
Bosch 8kg washing machine (model WAQ28470GB )
14.67p per cycle
Hotpoint 2200W Iron
16.95p per 30 minutes
Morphy Richards 2600W Power Steam (steam station)
20.03p per 30 minutes
AEG 8kg tumble dryer (model T97689IH3 )
23.27p per cycle
Triton Osiris 9.5kW Electric Shower
24.4p per 10 minute shower
2kw Convector Heater
£1.23p per day’s use
Source: https://www.sust-it.net/
Why not enter your own tariff and look up the specific models of your appliances?
As you know, the challenges are now complete and we are visiting each household to conduct the final interviews. It has been an insightful few months looking over the Energy Challenge responses and we’re grateful to everyone who has taken the time to participate in the project.
Over the summer and autumn we’re hoping to share some early findings with you, and we’ll continue monitoring for the remainder of the 18 month trial. However there won’t be any more challenges or vouchers. We’ll be back in touch at the end of the 18 months as we may be interested in continuing to monitor some houses. This will only happen with your active consent and of course you will be free to discontinue at any time.
Looking forward, we’re exploring ways of sharing the results with our participating households. If you have any preference, please let us know!
In the second of our series of profiles, we introduce Rosie, one of the social scientists on the team.

Name: Rosie Day
Specialist area:
Domestic energy demand; fuel poverty; public perspectives on environment and energy issues; research using interviews
Where do you work?
The School of Geography, Earth and Environmental Sciences at the University of Birmingham
What is your role within Smarter Households?
I am a social scientist which means I’m interested in social issues, people, and their experiences and what they think. I’m also interested in making sure that energy policies and new energy technologies are well designed so that they benefit as many people as possible. My role in the project is to bring that perspective to the design of the project. I also help to design the interviews and the energy challenges for households and will be very interested to see what householders tell us throughout the trial. I work closely with Georgina.
What excites you most about the project?
It has been really great to learn more about sensor systems and what they can do, and to be involved in the development of the Energy Dashboard that should help people to understand their consumption alongside the conditions in their home. I’m most excited to see how it works out in practice and what people’s thoughts are on it all when their trial it out in their homes. We hope to design something useful in the end, but we are really happy to hear people’s views and experiences whatever they are. Everyone is different and everyone’s experiences are interesting to us!
We hope that some of the Energy Challenges help you to use the Energy Dashboard app in different ways, find new features, and explore the data being collected, in order to make it useful to you.
Other challenges will help us to improve the apps we develop, or better understand the wider patterns and differences across our 20 participating households,
January’s challenge, about your indoor environment, is coming to a close. Thank you to all who have taken part!
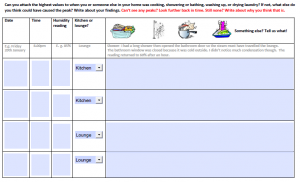
Future challenges will include a short diary activity, and a questionnaire to gather your household’s thoughts on our energy game.
There will be 4 challenges in total. Each challenge is worth a £5 voucher, except the game questionnaire which earns you £10. If you complete ALL the challenges, you will also receive a £5 bonus. So in total you could earn up to £30 in vouchers for completing all four activities.
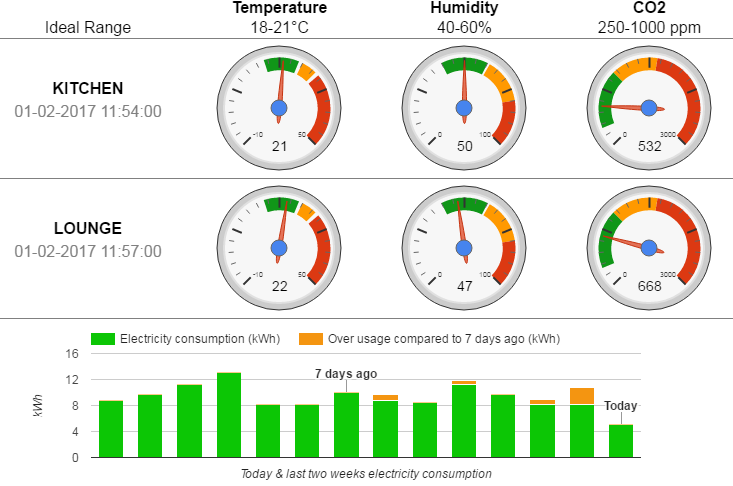
During the coming months you will be able to start using Version 2 of the Energy Dashboard, and you can see a sneak peek here!
We will also be releasing a first version of our energy game, which we would really like you and anyone else in your household to have a go at. We are particularly interested in hearing the opinions of older children and teenagers!
We will be continuing with our Energy Challenges along the way as well, so it will be a busy time indeed.
Thank you for your time and your enthusiasm during the first set of interviews, which took place in December and January- Georgina enjoyed speaking to you all. Your feedback on the Energy Dashboard app has already been passed on to the developers so that we can make sure as much of it as possible is taken on board during the development of the next version.

More in-depth work is now taking place using the transcribed interviews, to better understand the role of energy in everyday life and any ways in which technology can play a useful role.
We are also busy putting the finishing touches to Version 2 of the Energy Dashboard, which you will be able to use soon, We will send over full instructions as soon as it is ready!
I’ve forgotten how to use the Energy Dashboard! How can I get help?
Don’t worry! You can find our User Guide here. Use the side bar to read all the pages in the guide. If you are accessing it on your tablet, you might need to tap Download in order to view the guide. If you have any further questions, send us an email.
I re-downloaded the app and now I see an Authorization Failure page. How can I get into the app?
This is a security measure to keep your data safe. Email us the code you see (or a photo of the screen) and we’ll reactivate it for you as soon as we can. You won’t be able to access this code later on and you don’t need to remember it. Please don’t disclose the code to anyone else, if you’ve taken a picture of it or written it down.
My Energy Dashboard readings seem to not be up-to-date. Why is this?
This is an issue involving our sensor manufacturer. We are working hard to reduce the delay in data transfer and hope this will be resolved soon.
When I tap on Gas Consumption on the home screen, why does the content look different to the rest of the app?
Tapping on Gas Consumption takes you to your online account with Loop Energy. We have added this link to provide easy access to your gas use information, as it was not possible to display your real-time gas use directly on the Energy Dashboard. This information will be visible on the main Energy Dashboard the following week. If you have any queries about what is displayed here, we will be happy to raise these with Loop.
Where are my latest gas readings when I click on the History tab?
Gas use data will be displayed here on Mondays for the previous week. For up-to-date information on your gas use, tap on Gas Consumption on the home screen to visit your online Loop account.
I can’t see any readings in the History tab!
Make sure you select the date you are interested and tap Show History. Unchecking Show Issues Only will show you all readings for that date. If the box is checked, it will only show readings that are outside the ideal range.
How are my savings calculated, in the Achievements section?
Your daily saving compares today to the same day last week (e.g. Friday to Friday). Bear in mind that it will compare to the whole day, so your savings calculation will be most useful in the evening. Your monthly saving compares the last 4 weeks to the previous 4 week period.
I think a reading is wrong. What should I do?
Please let us know! Email is always the best way to contact us if it is regarding a technical issue or query.
Is there something specific I should be doing on the Energy Dashboard?
We’re simply interested in how useful you find the app (and subsequent versions of it) in your everyday life, and whether it can help you to find ways to save energy or make your indoor environment more healthy and comfortable.
What might cause spikes in the carbon dioxide level during the night?
There is no clear reason for this, but a person walking around is likely to produce more carbon dioxide than someone lying or sitting down. Securing the doors and windows at night to improve security might affect the air flow through the house; reducing ventilation and potentially increasing carbon dioxide levels.
How can the carbon dioxide level be brought down?
The most effective way to bring down carbon dioxide levels is to encourage air circulation- opening doors, opening windows, and potentially using fans for additional ventilation. Plants can also help reduce the amount of carbon dioxide in the home.
Are low levels of carbon dioxide an issue?
This is unlikely to be a problem.
How does humidity link to condensation?
Warm air holds more moisture than cold air, so when air cools down, its relative humidity (as a percentage) increases. Relative humidity is the measure of the amount of water vapour actually in the air compared to the maximum amount of water vapour the air can hold at that particular temperature and pressure.
If the amount of water vapour in the air continues to increase, or the temperature continues to fall, the excess water drops out in liquid form, often against cold surfaces like windows (condensation). This is more likely if there is limited air circulation (e.g. through vents or open windows). When air remains still, next to a cool surface like a window, it cools down sooner than air that is well circulated.
Sometimes mould can grow on clothes and shoes when relative humidity is high, even if condensation is not noticeable.
Is low humidity an issue? Why is my humidity low?
Low relative humidity can cause sore eyes, dry throat, itchy or dry skin, or a blocked nose. It can increase the risk of colds, flue and other infections. Those who breathe through their mouths whilst sleeping may be more affected by low humidity levels. Low relative humidity levels are more likely in winter due to cold and dry outdoor conditions and central heating.