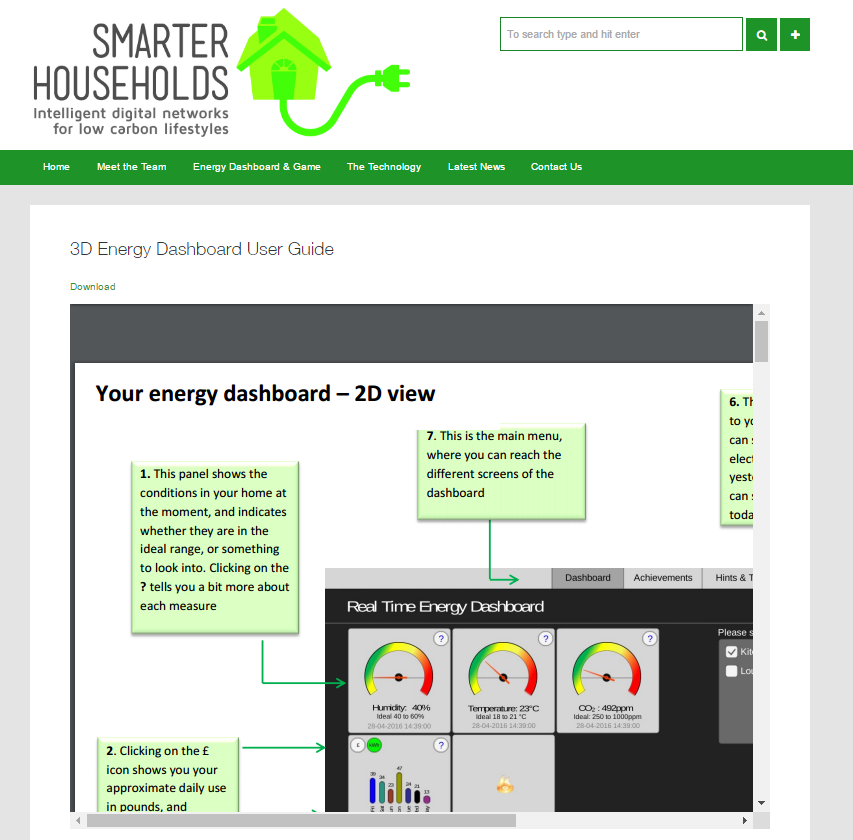
I’ve forgotten how to use the Energy Dashboard! How can I get help?
Don’t worry! You can find our User Guide here. Use the side bar to read all the pages in the guide. If you are accessing it on your tablet, you might need to tap Download in order to view the guide. If you have any further questions, send us an email.
I re-downloaded the app and now I see an Authorization Failure page. How can I get into the app?
This is a security measure to keep your data safe. Email us the code you see (or a photo of the screen) and we’ll reactivate it for you as soon as we can. You won’t be able to access this code later on and you don’t need to remember it. Please don’t disclose the code to anyone else, if you’ve taken a picture of it or written it down.
My Energy Dashboard readings seem to not be up-to-date. Why is this?
This is an issue involving our sensor manufacturer. We are working hard to reduce the delay in data transfer and hope this will be resolved soon.
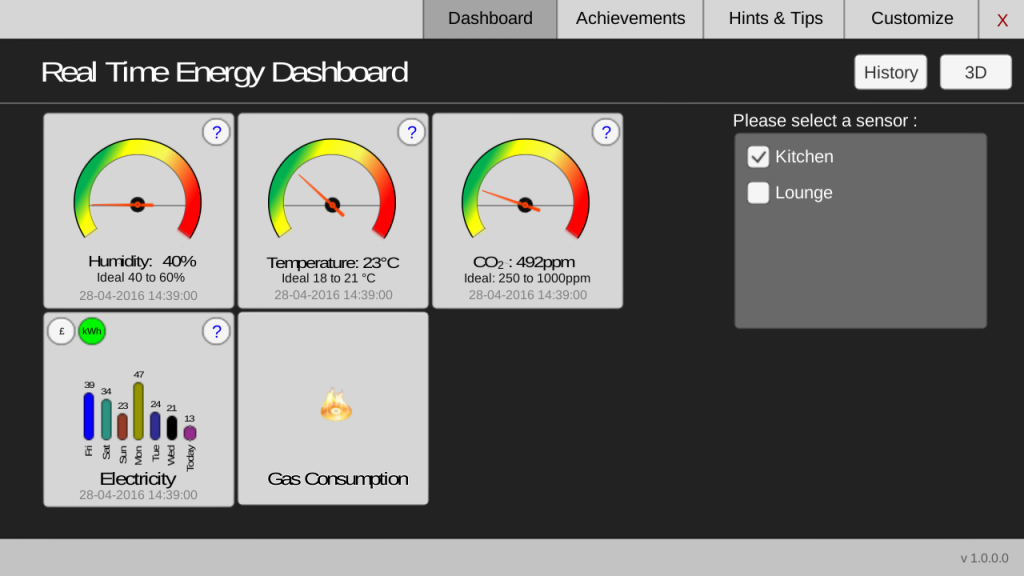
When I tap on Gas Consumption on the home screen, why does the content look different to the rest of the app?
Tapping on Gas Consumption takes you to your online account with Loop Energy. We have added this link to provide easy access to your gas use information, as it was not possible to display your real-time gas use directly on the Energy Dashboard. This information will be visible on the main Energy Dashboard the following week. If you have any queries about what is displayed here, we will be happy to raise these with Loop.
Where are my latest gas readings when I click on the History tab?
Gas use data will be displayed here on Mondays for the previous week. For up-to-date information on your gas use, tap on Gas Consumption on the home screen to visit your online Loop account.
I can’t see any readings in the History tab!
Make sure you select the date you are interested and tap Show History. Unchecking Show Issues Only will show you all readings for that date. If the box is checked, it will only show readings that are outside the ideal range.
How are my savings calculated, in the Achievements section?
Your daily saving compares today to the same day last week (e.g. Friday to Friday). Bear in mind that it will compare to the whole day, so your savings calculation will be most useful in the evening. Your monthly saving compares the last 4 weeks to the previous 4 week period.
I think a reading is wrong. What should I do?
Please let us know! Email is always the best way to contact us if it is regarding a technical issue or query.
Is there something specific I should be doing on the Energy Dashboard?
We’re simply interested in how useful you find the app (and subsequent versions of it) in your everyday life, and whether it can help you to find ways to save energy or make your indoor environment more healthy and comfortable.
What might cause spikes in the carbon dioxide level during the night?
There is no clear reason for this, but a person walking around is likely to produce more carbon dioxide than someone lying or sitting down. Securing the doors and windows at night to improve security might affect the air flow through the house; reducing ventilation and potentially increasing carbon dioxide levels.
How can the carbon dioxide level be brought down?
The most effective way to bring down carbon dioxide levels is to encourage air circulation- opening doors, opening windows, and potentially using fans for additional ventilation. Plants can also help reduce the amount of carbon dioxide in the home.
Are low levels of carbon dioxide an issue?
This is unlikely to be a problem.
How does humidity link to condensation?
Warm air holds more moisture than cold air, so when air cools down, its relative humidity (as a percentage) increases. Relative humidity is the measure of the amount of water vapour actually in the air compared to the maximum amount of water vapour the air can hold at that particular temperature and pressure.
If the amount of water vapour in the air continues to increase, or the temperature continues to fall, the excess water drops out in liquid form, often against cold surfaces like windows (condensation). This is more likely if there is limited air circulation (e.g. through vents or open windows). When air remains still, next to a cool surface like a window, it cools down sooner than air that is well circulated.
Sometimes mould can grow on clothes and shoes when relative humidity is high, even if condensation is not noticeable.
Is low humidity an issue? Why is my humidity low?
Low relative humidity can cause sore eyes, dry throat, itchy or dry skin, or a blocked nose. It can increase the risk of colds, flue and other infections. Those who breathe through their mouths whilst sleeping may be more affected by low humidity levels. Low relative humidity levels are more likely in winter due to cold and dry outdoor conditions and central heating.